Server Logs
NuxtHub Admin
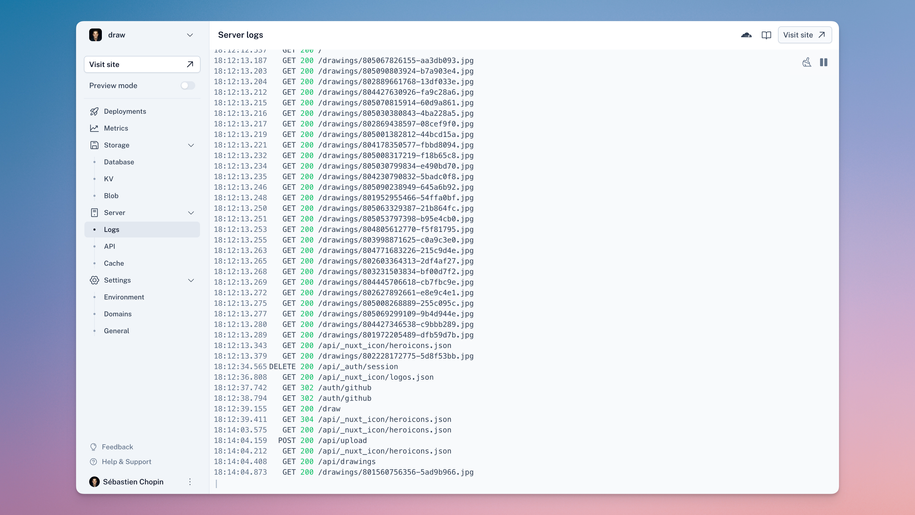
When you have a successful deployment, you can access to the logs of the deployment in the NuxtHub Admin.
Logs are available under the Server > Logs section of your project page. You can also access to the logs of each successful deployment in the Deployments section.
NuxtHub CLI
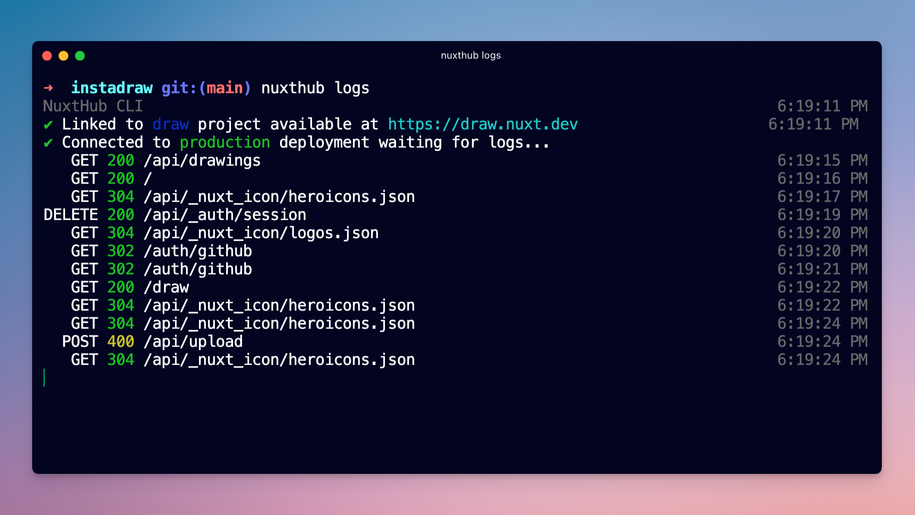
Using the NuxtHub CLI, you can access to the logs of both production and preview deployments.
By default, the CLI will detect based on the current branch the canonical deployment of your project and stream the logs of that deployment in the CLI.
npx nuxthub logs
Production environment
To access the logs of the production environment, you can use the --production flag.
npx nuxthub logs --production
Preview environment
In preview environment, NuxtHub will stream the logs of the latest successful deployment in the CLI.
npx nuxthub logs --preview
Cloudflare Dashboard
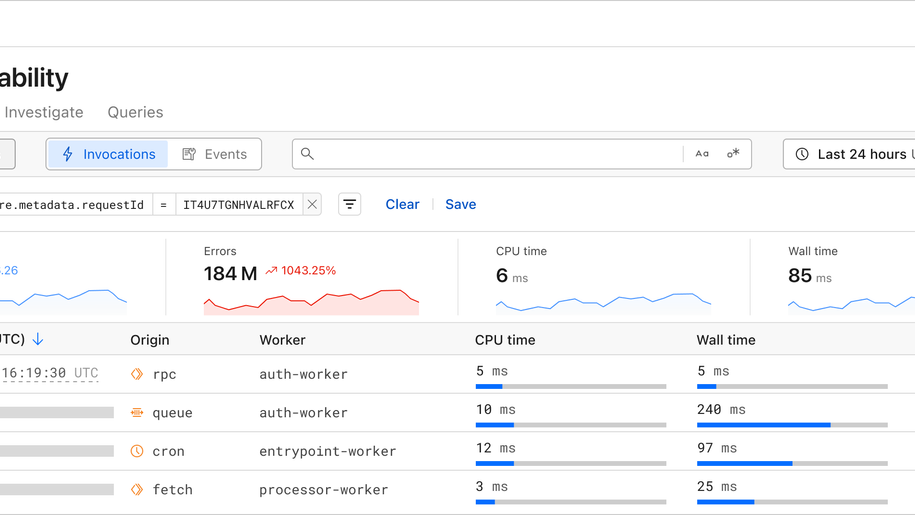
Worker project types can enable Worker Logs and view the Workers Observability tab dashboard in Cloudflare. Learn more on the Cloudflare documentation.
Enable Worker Logs
Enable Worker Logs within hub.bindings.observability.logs in your nuxt.config.ts.
logsboolean | objectEnable Worker Logs with default configuration.
Defaults tohead_sampling_rate: 1andinvocation_logs: truelogsboolean | objectEnable Worker Logs with custom configuration.head_sampling_ratenumberHead-based sampling allows you to log a percentage of incoming requests to your Nuxt app. Especially for high-traffic applications, this helps reduce log volume and manage costs, while still providing meaningful insights into your application's performance. When you configure a head-based sampling rate, you can control the percentage of requests that get logged. All logs within the context of the request are collected.
To enable head-based sampling, sethead_sampling_ratewithin the observability configuration. The valid range is from 0 to 1, where 0 indicates zero out of one hundred requests are logged, and 1 indicates every request is logged. Ifhead_sampling_rateis unspecified, it is configured to a default value of 1 (100%). In the example below,head_sampling_rateis set to 0.01, which > means one out of every one hundred requests is logged.invocation_logsboolean?Each Workers invocation returns a single invocation log that contains details such as the Request, Response, and related metadata. These invocation logs can be identified by the field $cloudflare.$metadata.type = "cf-worker-event". Each invocation log is enriched with information available to Cloudflare in the context of the invocation.
In the Workers Logs UI, logs are presented with a localized timestamp and a message. The message is dependent on the invocation handler. For example, Fetch requests will have a message describing the request method and the request URL, while cron events will be listed as cron. Below is a list of invocation handlers along with their invocation message.